The brief
Lead Academy sells accredited and CPD online courses to UK learners through a WooCommerce store.
I joined through Orbit Technology in August 2021. Paid search was losing money. Organic search was a small channel for a site with more than 3,000 course pages. Web sales had fallen to about £3,400 a month by August 2021.
Over the next 16 months I rebuilt the Google Ads account, ran a content-led SEO programme and joined up Meta Ads, email and tracking, so every channel pushed the same course offers.
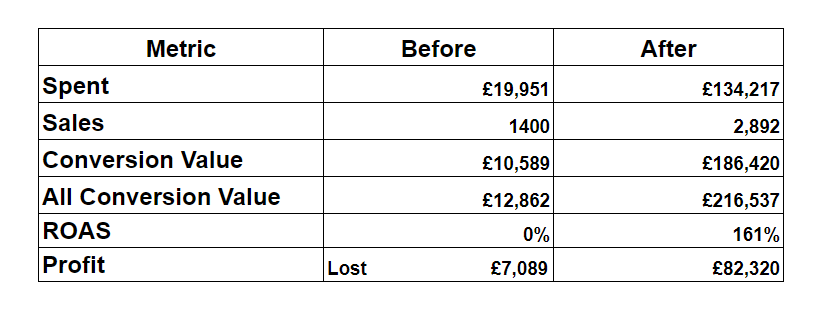
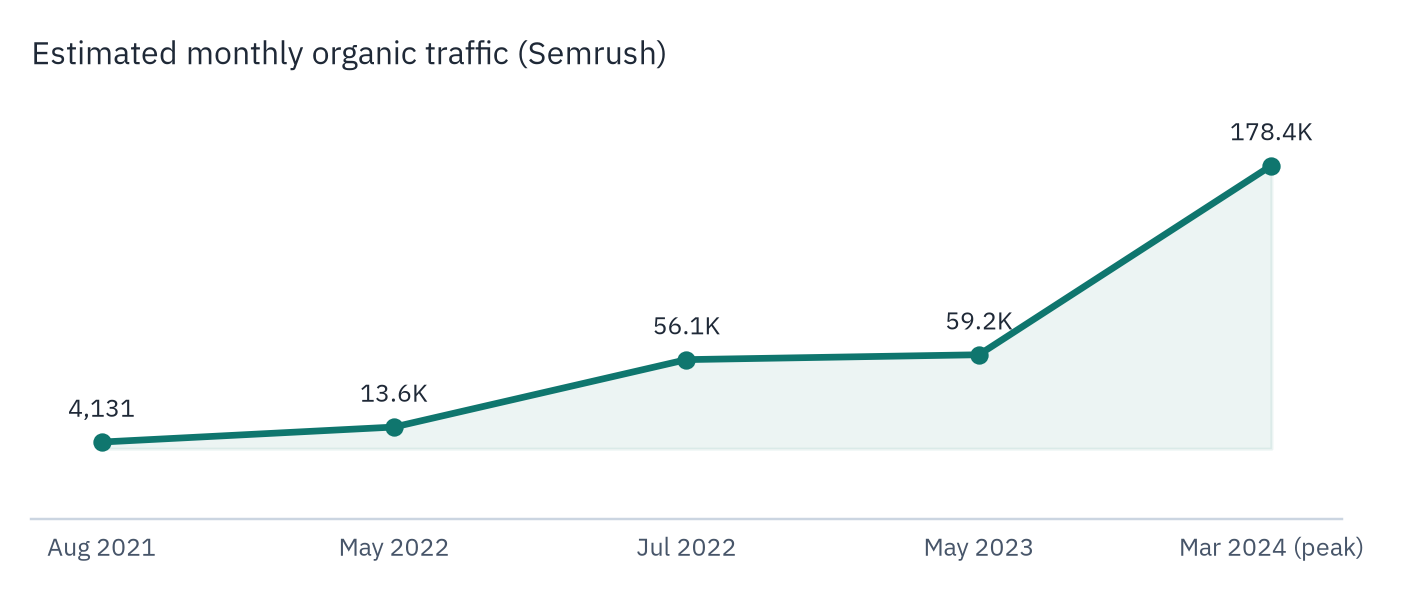
In the first 12 months store sales more than doubled. Google Ads moved from a £7,089 shortfall to £82,320 of value above ad spend. Semrush estimated organic traffic at 4,131 visits a month when I started, 56.1K by July 2022 and 59,176 by May 2023.
The business sells high-volume, low-ticket courses, typically under £100 each.
The site had thousands of course (product) pages and a large but disengaged email list. Most sales came through third-party deal and listing sites, not the website. The brief: make the website the main sales channel and grow direct, trackable online revenue.
My remit covered SEO, Google Ads (Search, Dynamic Search Ads, Display remarketing and page feeds), Meta dynamic retargeting with the Conversions API, Mailchimp abandoned-cart automation, Google Tag Manager and Google Analytics, plus day-to-day management of the in-house marketing team.
What made it hard
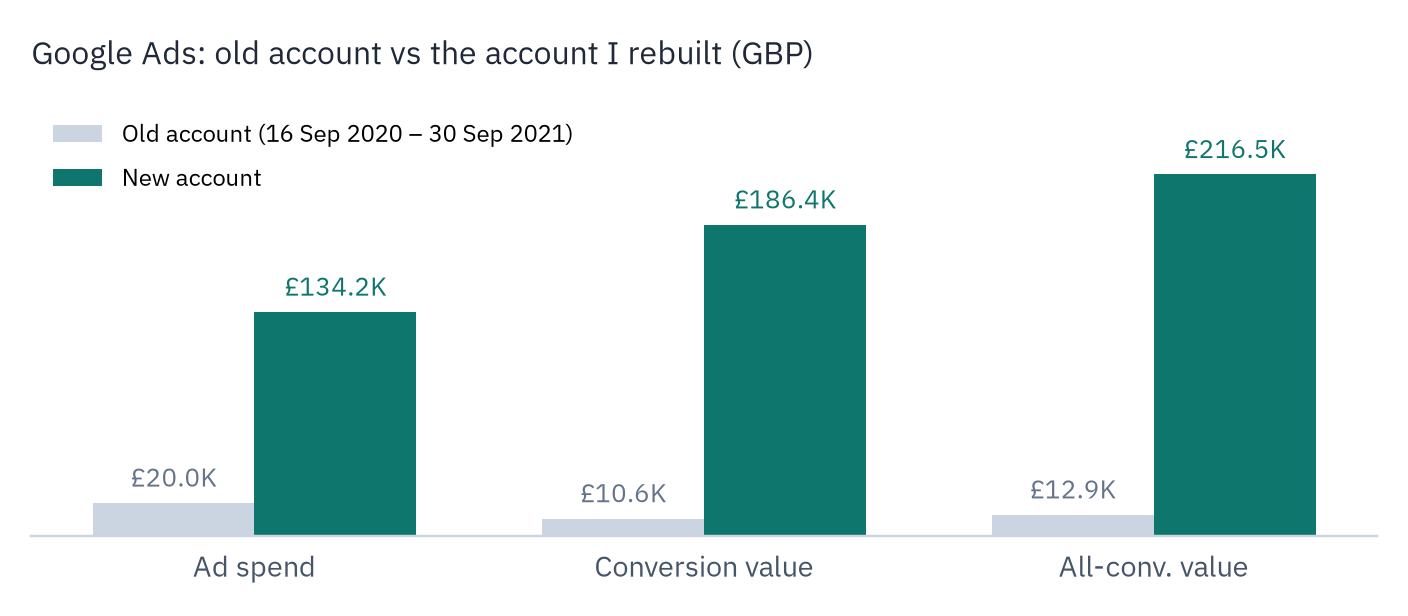
- Loss-making paid search. More than three previous ad specialists had run 41 campaigns. Between 16 Sep 2020 and 30 Sep 2021 the account spent £19,951 for £10,589 of conversion value (£12,862 all-conversion value): a £7,089 shortfall.
- Unit economics. Keywords such as “functional skills course” cost about £2 per click, while the listed course sold for about £25. A sale could not pay for itself.
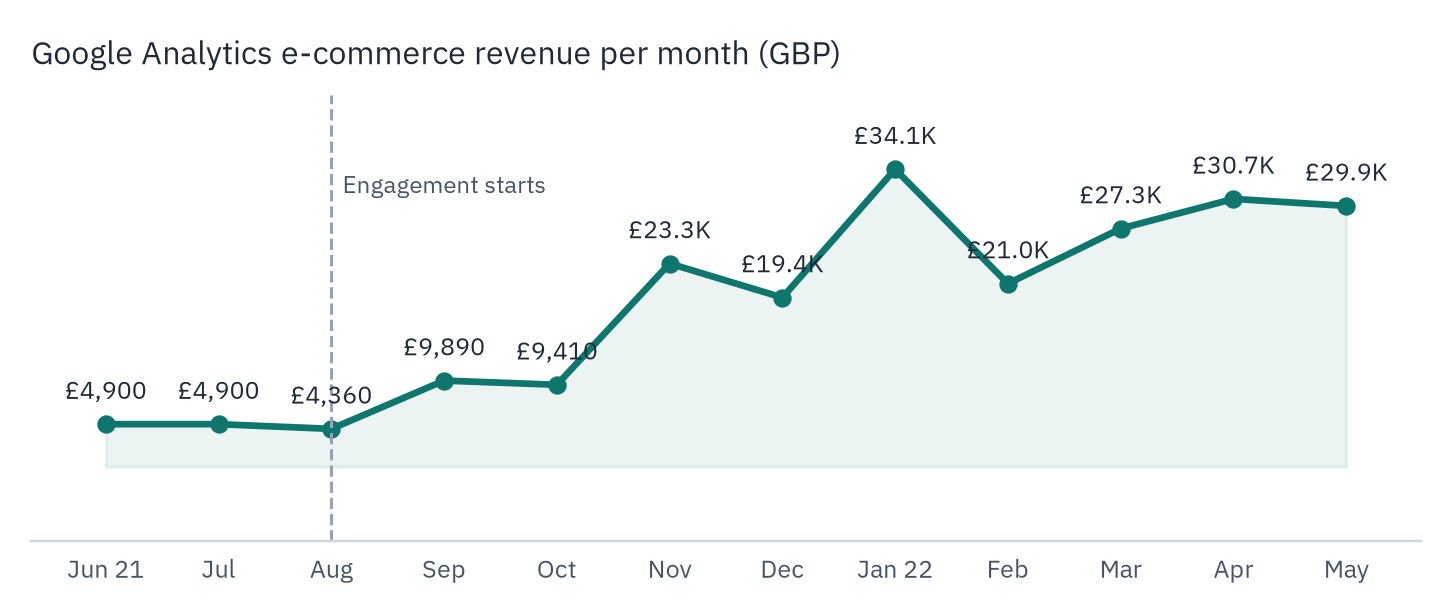
- Falling web sales. Website sales fell from an average of about £7,500 a month in late 2020 to about £3,400 in August 2021 (my published case study). Google Analytics e-commerce revenue was about £4.9K a month in June–July 2021.
- Weak organic footprint. Semrush estimated 4,131 organic visits a month in August 2021 across a very large catalogue, with no structured blog or content programme.
- Low email engagement. A list of about 63,000 subscribers with open rates below 0.89% (case-study records).
- A crowded market. Large MOOC platforms and course resellers competed for the same searches, including the brand name.
How I approached it
- Offer structure (product tiers). Entry-level “Starter” courses to win first purchases. Mid-level “Core Value” career packages as the main revenue line. Bundles and advanced courses as profit maximisers. Each tier had its own message and landing pages.
- Google Ads rebuild. A new account: Dynamic Search Ads for high-demand starter courses, tightly themed Search campaigns for career packages, Display remarketing and page feeds. Purchase tracking passed dynamic order values.
- SEO and content. Keyword research for course and career-intent queries. A blog calendar of 239 planned posts plus 66 Web 2.0 posts. About 127 blog URLs moved into a dedicated /blog/ section. Course-page keyword research and steady link building.
- Meta Ads. Conversion campaigns for career packages, dynamic remarketing, cross-sell catalogue campaigns and the Conversions API.
- Lifecycle. Mailchimp abandoned-cart and up-sell journeys, alongside WooCommerce upsells.
- Measurement. GTM, Google Analytics, enhanced and dynamic-value conversion tracking, so bidding and reporting used real revenue. Weekly performance reporting.
What I did
How I solved it: The ads experts were fine. The product and the site were not.
- I reviewed the Google Ads account and found no clear campaign mistakes from the previous specialists. The real issue was unit economics: about £2 CPC against a course selling for about £25.
- I pushed the business to onboard high-value, accredited courses (for example Functional Skills with live exams, and Phlebotomy) instead of low-price CPD-style listings that created little career value.
- I split the messy single database into three: the LMS on its own subdomain, the main WooCommerce course site, and a WordPress blog subdomain. Course pages and content could then be optimised properly.
- I applied an omnichannel / inbound system: product tiers (Starter → Core → bundles), rebuilt Search/DSA/remarketing with value tracking, a multi-year content calendar (hundreds of keyworded ideas by category) and a Meta + email lifecycle. I trained juniors to keep running the roadmap after I left.
- Audited the website, ads accounts, SEO and email programme, and wrote the growth plan.
- Built and optimised the new Google Ads account and its campaign structure.
- Set up and managed the Meta account: Pixel/CAPI, dynamic retargeting and email automations.
- Planned the content calendar, briefed writers and tracked blog rankings.
- Built the tracking and ran weekly and monthly reporting.
- Managed the in-house marketing team’s task lists.
- Promoted to Head of Digital Marketing in August 2022. Named Employee of the Month at Orbit Technology in November 2021, January 2022 and March 2022.
The numbers
Google Ads: before and after
| Metric | Old account | New account | Source and period |
|---|---|---|---|
| Ad spend | £19,951 | £134,217 | Google Ads; old = 16 Sep 2020 – 30 Sep 2021; new account date range not shown (captured 2023) |
| Sales (conversions) | 1,400 | 2,892 | Same before/after grid |
| Conversion value | £10,589 | £186,420 | Same |
| All-conversion value | £12,862 | £216,537 | Same; ROAS 161% after |
| Value above ad spend* | −£7,089 | +£82,320 | All-conversion value minus ad spend |
All-conversion value minus ad spend. This is not profit. On primary conversion value the surplus is £52,203.
Web sales
| Metric | Before | After | Source and period |
|---|---|---|---|
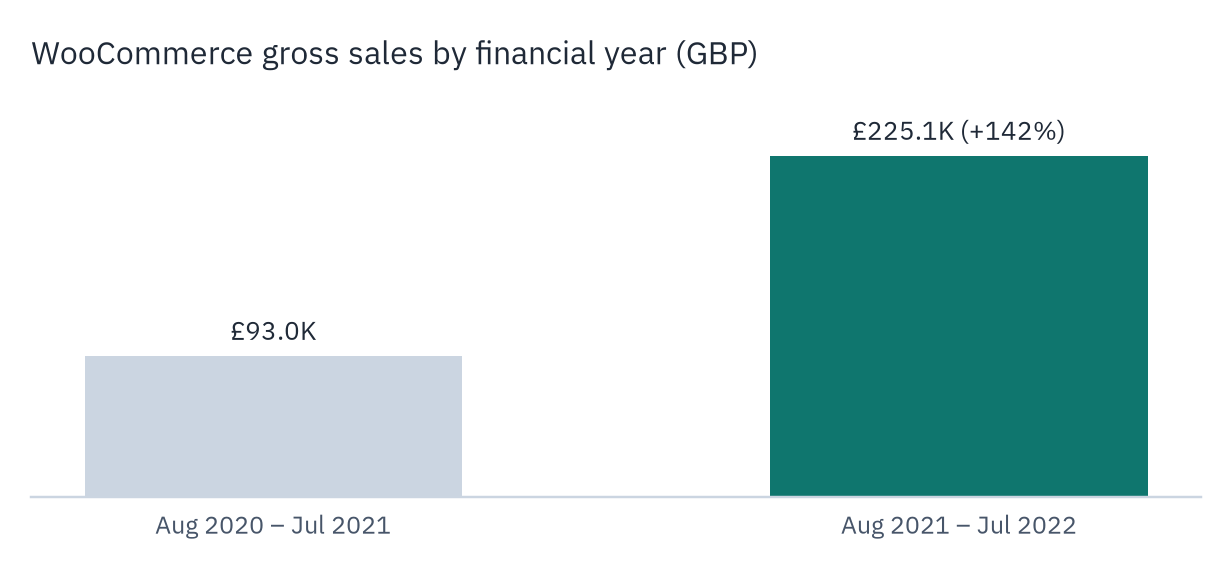
| WooCommerce gross sales (12 months) | £92,999.94 | £225,148.63 (+142%) | WooCommerce; Aug 2020 – Jul 2021 vs Aug 2021 – Jul 2022 |
| WooCommerce net sales (12 months) | £83,975.40 | £189,824.44 (+126%) | Same |
| Gross sales, 1 Aug 2021 – 28 Nov 2022 | — | £335,159.69 from 7,869 orders (≈£20,947 / month) | WooCommerce |
| Customer sign-ups | — | 52,240 | WooCommerce |
| GA e-commerce revenue / month | ~£4.9K (Jun 2021) | ~£30.7K (Apr 2022) | Google Analytics (UA), read from mobile-app screenshots |
| Monthly web sales (published case study) | ~£3,000 | £30,000+ | My published case study; GA figures above support it |
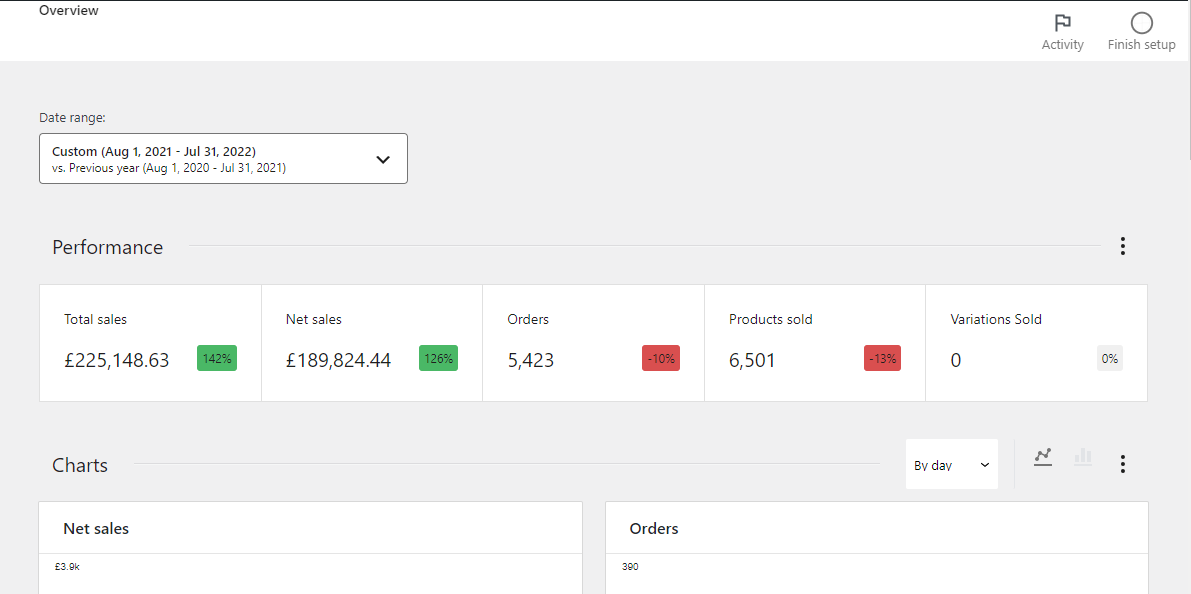
Verbally verified sales.
The WooCommerce and Google Ads sales and conversion-value figures in this case are verbally verified sales: verified verbally by Solayman against the account screenshots and exports shown here.
SEO
| Metric | Value | Source and period |
|---|---|---|
| Organic traffic / month | 4,131 (Aug 2021) → 13.6K (May 2022) → 56.1K (19 Jul 2022) | Semrush estimate, during my tenure |
| Organic traffic / month, after | 59,176 with 43.2K ranking keywords | Semrush, 23 May 2023 (after my role ended) |
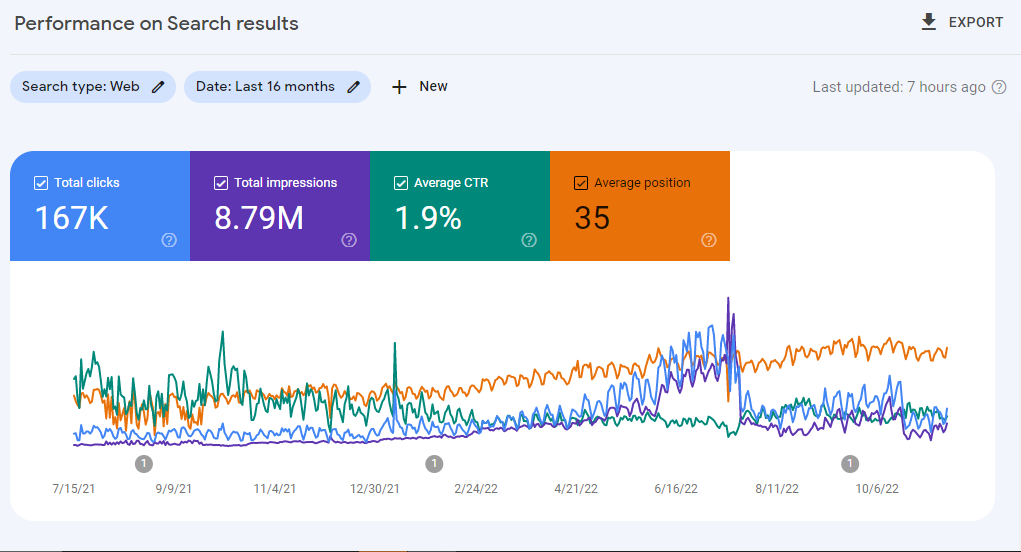
| Search Console | 167K clicks · 8.79M impressions | 16 months to 16 Nov 2022 |
| Referring domains | 734 → 2,684 | Backlink tool snapshots |
| Backlinks | ~3,800 → 96,467 | Same |
| Blog rankings | 161 of 256 tracked posts ranked; 114 in the top 10, 72 in the top 3 | Rank tracker, Apr 2023 |
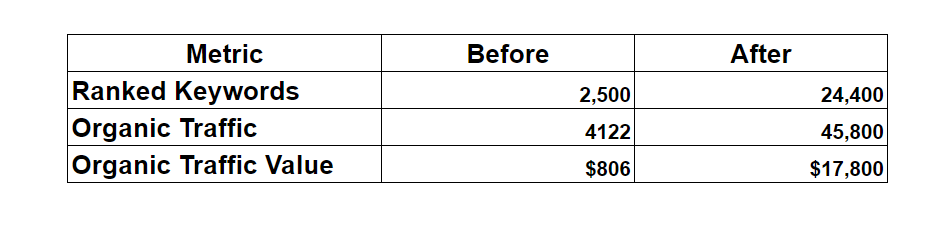
| Before/after grid | Ranked keywords 2,500 → 24,400; organic traffic 4,122 → 45,800; traffic value $806 → $17,800 | Case-study grid (no tool or date shown) |
Other channels
| Metric | Value | Source and period |
|---|---|---|
| Meta dynamic remarketing | £13,674 return on £3,584 spend (ROAS 3.81) | Meta Ads, 6 Jan 2021 – 29 Nov 2022 (partly before my start) |
| Email list | ~63,000 → 120,000+ subscribers | Case-study records |
| Email open rate | 15% | Case-study records |
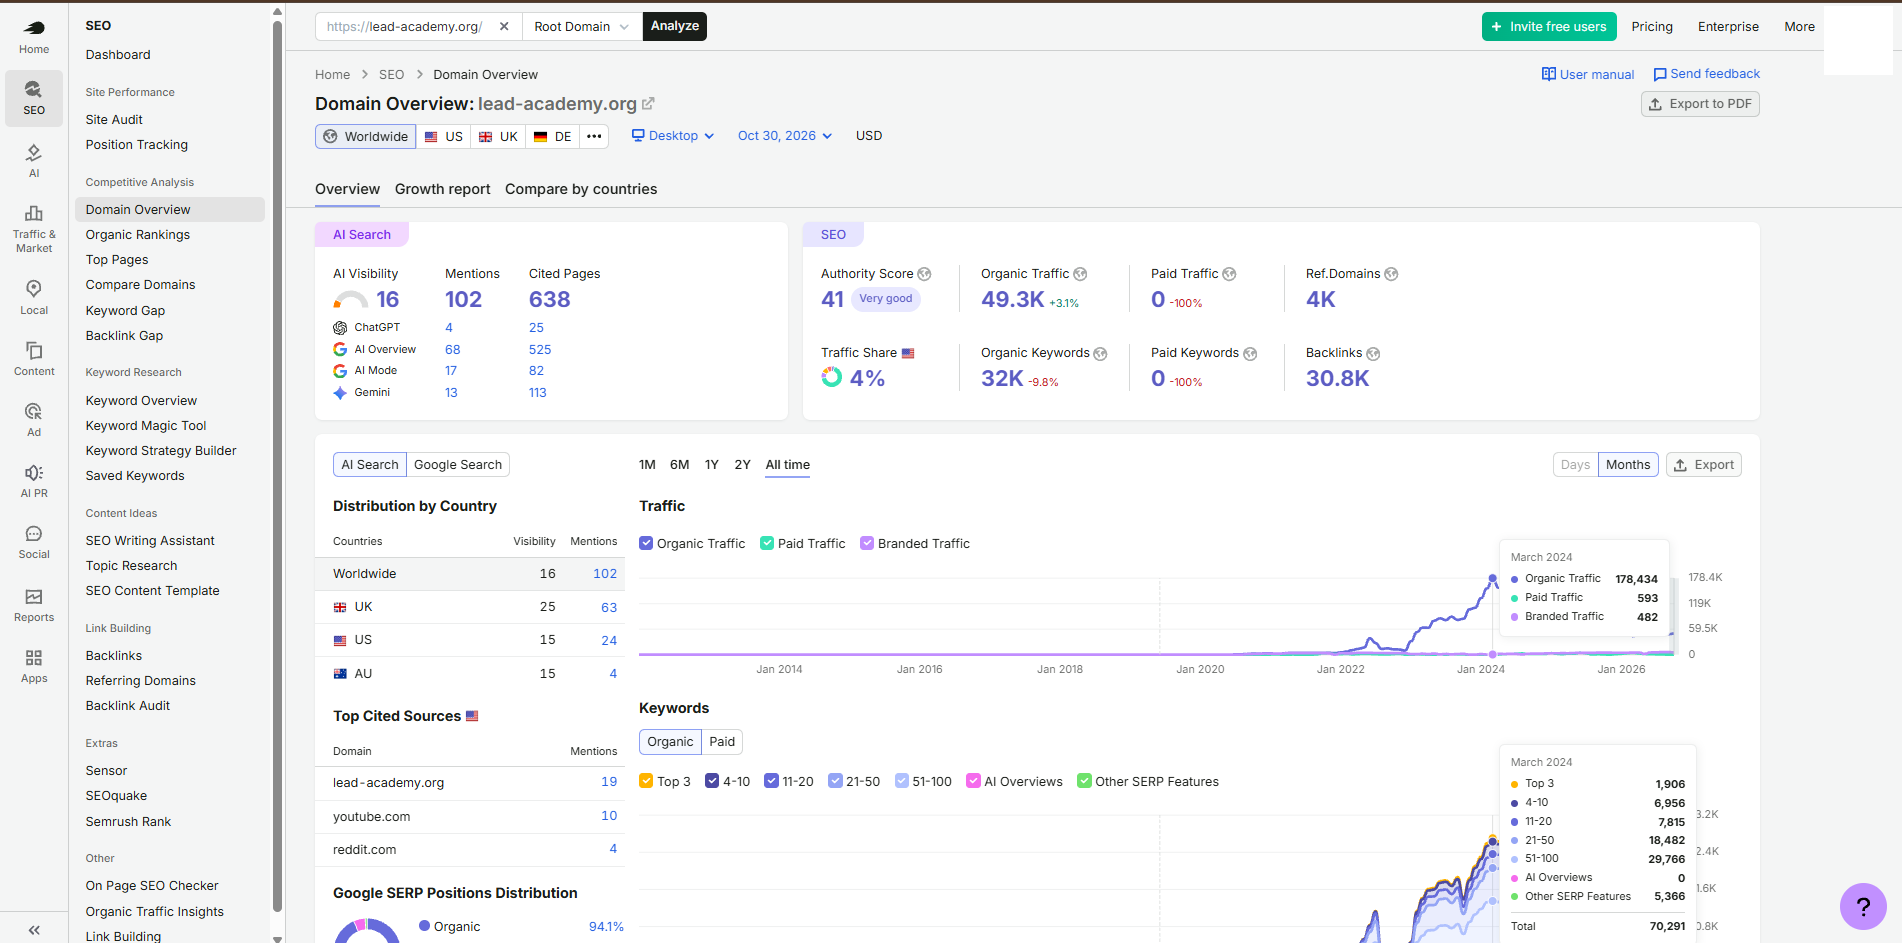
After the engagement: proven organic traffic
The foundation kept compounding. Semrush Domain Overview for lead-academy.org (captured 30 Oct 2026) shows organic traffic peaking at 178,434 visits/month in March 2024, with 70,291 ranking keywords that month (1,906 in the top 3). At capture date: organic traffic 49.3K/month, 32K organic keywords, Authority Score 41, 4K referring domains and 30.8K backlinks.